A Market Overview and Analysis of Belmont and its Second Quarter, 2014
We invite you to review the residential market update for Belmont. These tables provide the sales data for single family homes in the 2nd quarter of 2014 compared to the 2nd quarter of 2013.
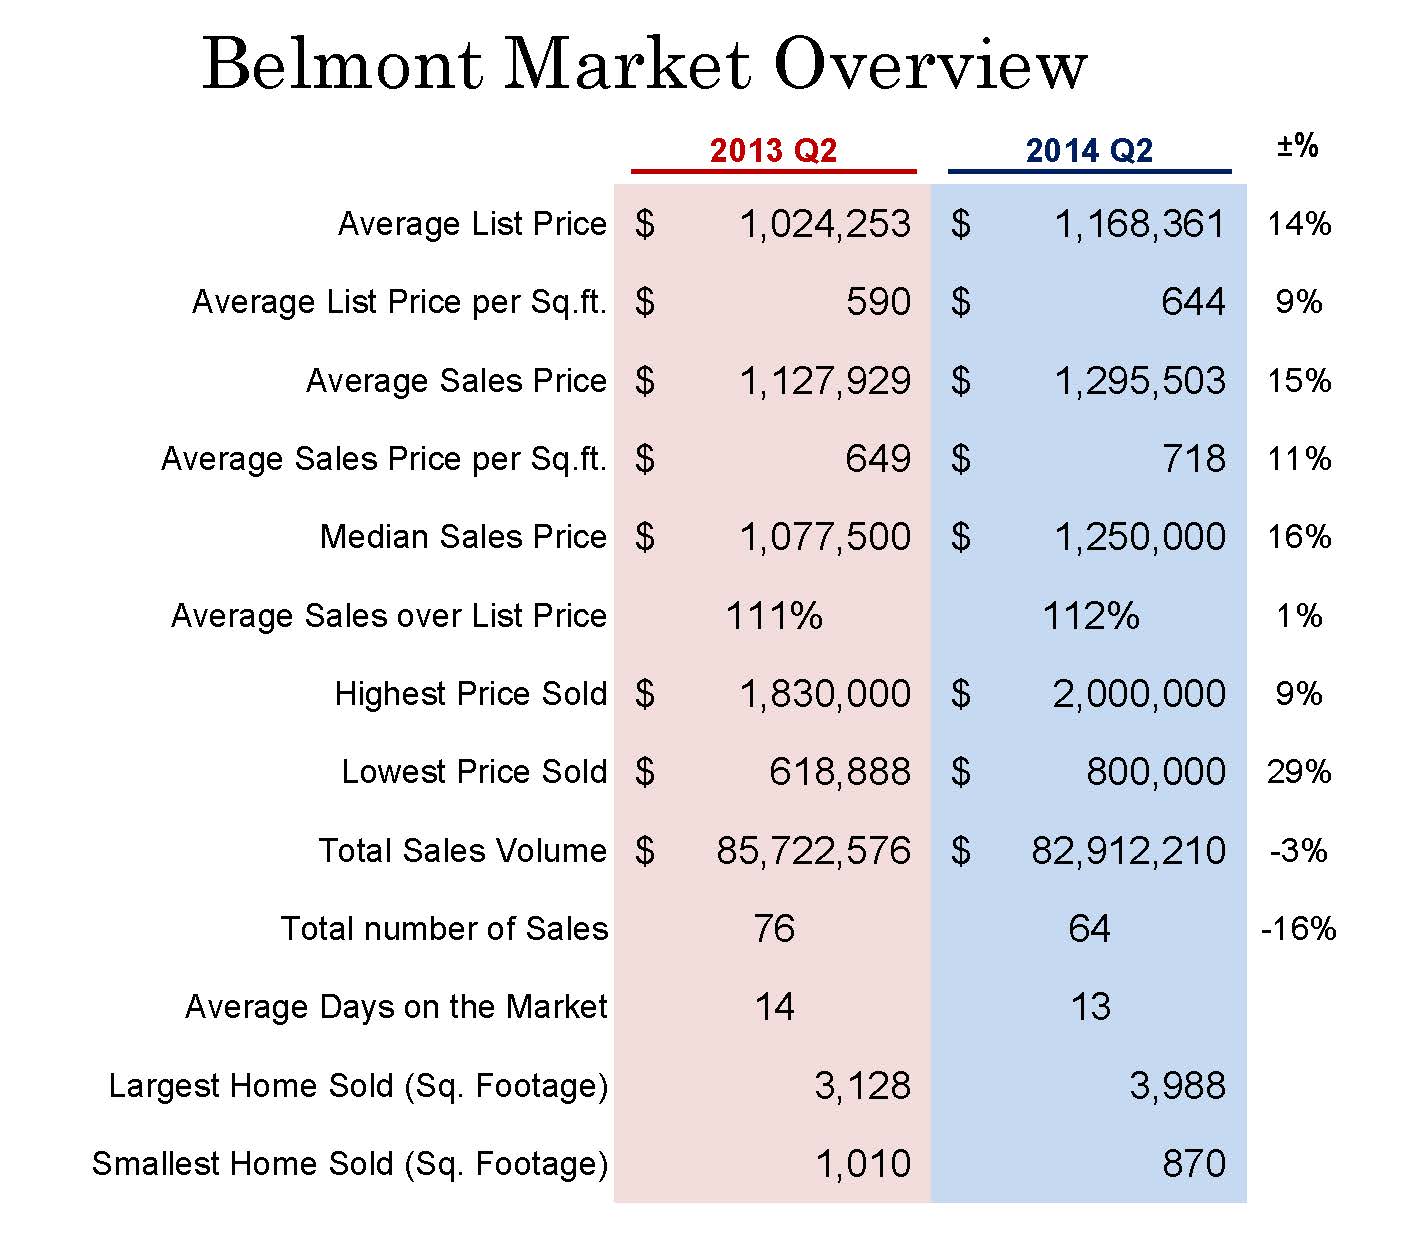 Single family home prices indicate steady growth in the 2nd Quarter of 2014 compared to 2013. And the average list price increased 14% from $1,024,253 to $1,168,361. The average list price per sq ft increased 9% rising from $590 per sq ft to $644 per sq ft. Overall, the average sales price and median sales price in Belmont increase by 15 to 16%.
The average sales price in the 2nd quarter of 2014 is $1,295,503 versus $1,127,929 in the 2nd quarter of 2013. The median sales price in the 2nd quarter of 2014 is $1,250,000 versus $1,077,500 in the 2nd quarter in 2013. The average sold price per square feet in the 2nd quarter of 2014 is $718 versus $649 in the 2nd quarter of 2013. Homes were sold in an average of 13 days on the market and the average sales price over list price being 112%.
In terms of the number of sales transactions, this decreased by 16% from 76 sales transactions in the 2nd quarter of 2013 to 64 in the 2nd quarter of 2014. The total sales volume for the 2nd quarter of 2014 decreased 3 % to $82,912,210 versus the $85,722,576 in the 2nd quarter of 2013.
The highest price home sold in the 2nd quarter of 2014 was $2,000,000 (32 Elder Drive) whereas the highest price home sold in the 2nd quarter of 2013 was $1,830,000. The lowest price home sold in the 2nd quarter of 2014 was $800,000 (496 Mountain View Avenue) and the lowest price home sold in the 2nd quarter of 2013 was $618,888.
Top Ten homes with the highest percentage on sold price over list price for Belmont in the 2nd quarter of 2014.
- 2115 Shirley Road | 3bd 2ba 1,900sf LP$975,000 SOLD for $1,430,000 → 47% over list
- 1710 Francis Court | 2bd 1.5ba 1,200sf LP$899,000 SOLD for $1,180,000 → 31% over list
- 1117 Villa Avenue | 3bd 2ba 1,640sf LP$965,000 SOLD for $1,220,000 → 26% over list
- 2008 Monroe Avenue | 3bd 2ba 1,160sf LP$940,000 SOLD for $1,180,000 → 26% over list
- 2401 Buena Vista Avenue | 3bd 1ba 1,030 LP$838,000 SOLD for $1,032,000 → 23% over list
- 2406 Palmer Avenue | 3bd 2.5ba 1,950sf LP$1,235,000 SOLD for $1,520,310 → 23% over list
- 1909 Lyon Avenue | 3bd 3ba 1,600sf LP$995,000 SOLD for $1,220,000 → 23% over list
- 2615 Hastings Drive |3bd 2.5ba 2,210sf LP$1,199,000 SOLD for $1,470,000 → 23% over list
- 1517 Sunnyslope Avenue | 4bd 3ba 1,820sf LP$1,195,000 SOLD for $1,460,000 → 22% over list
- 52 Rinconada Circle | 3bd 2.5ba 2,230sf LP$1,050,000 SOLD for $1,276,000 → 22% over list
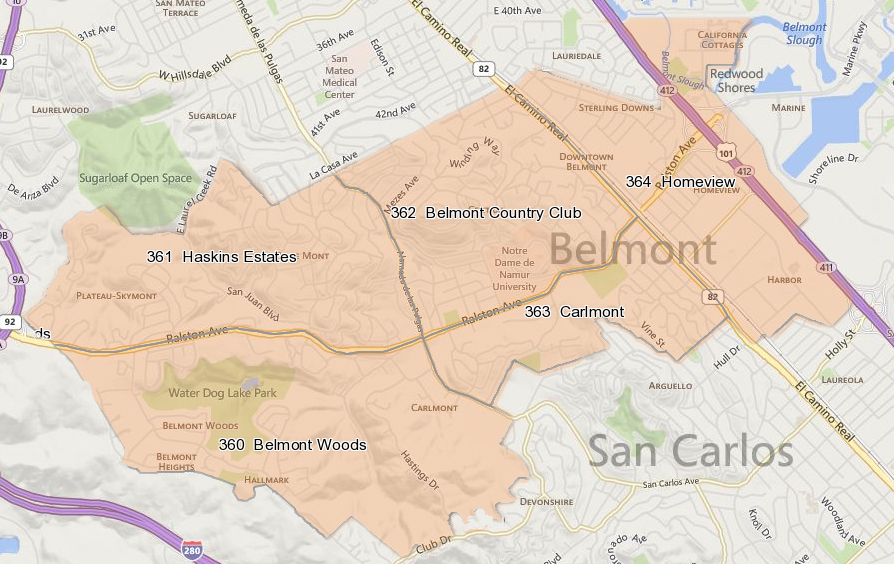
For those of you who are not familiar with the MLS area, Belmont consists of 5 MLS areas:
Belmont Wood – area 360
Haskins Estates – area 361
Belmont Country Club – area 362
Carlmont – area 363
Homeview – area 364
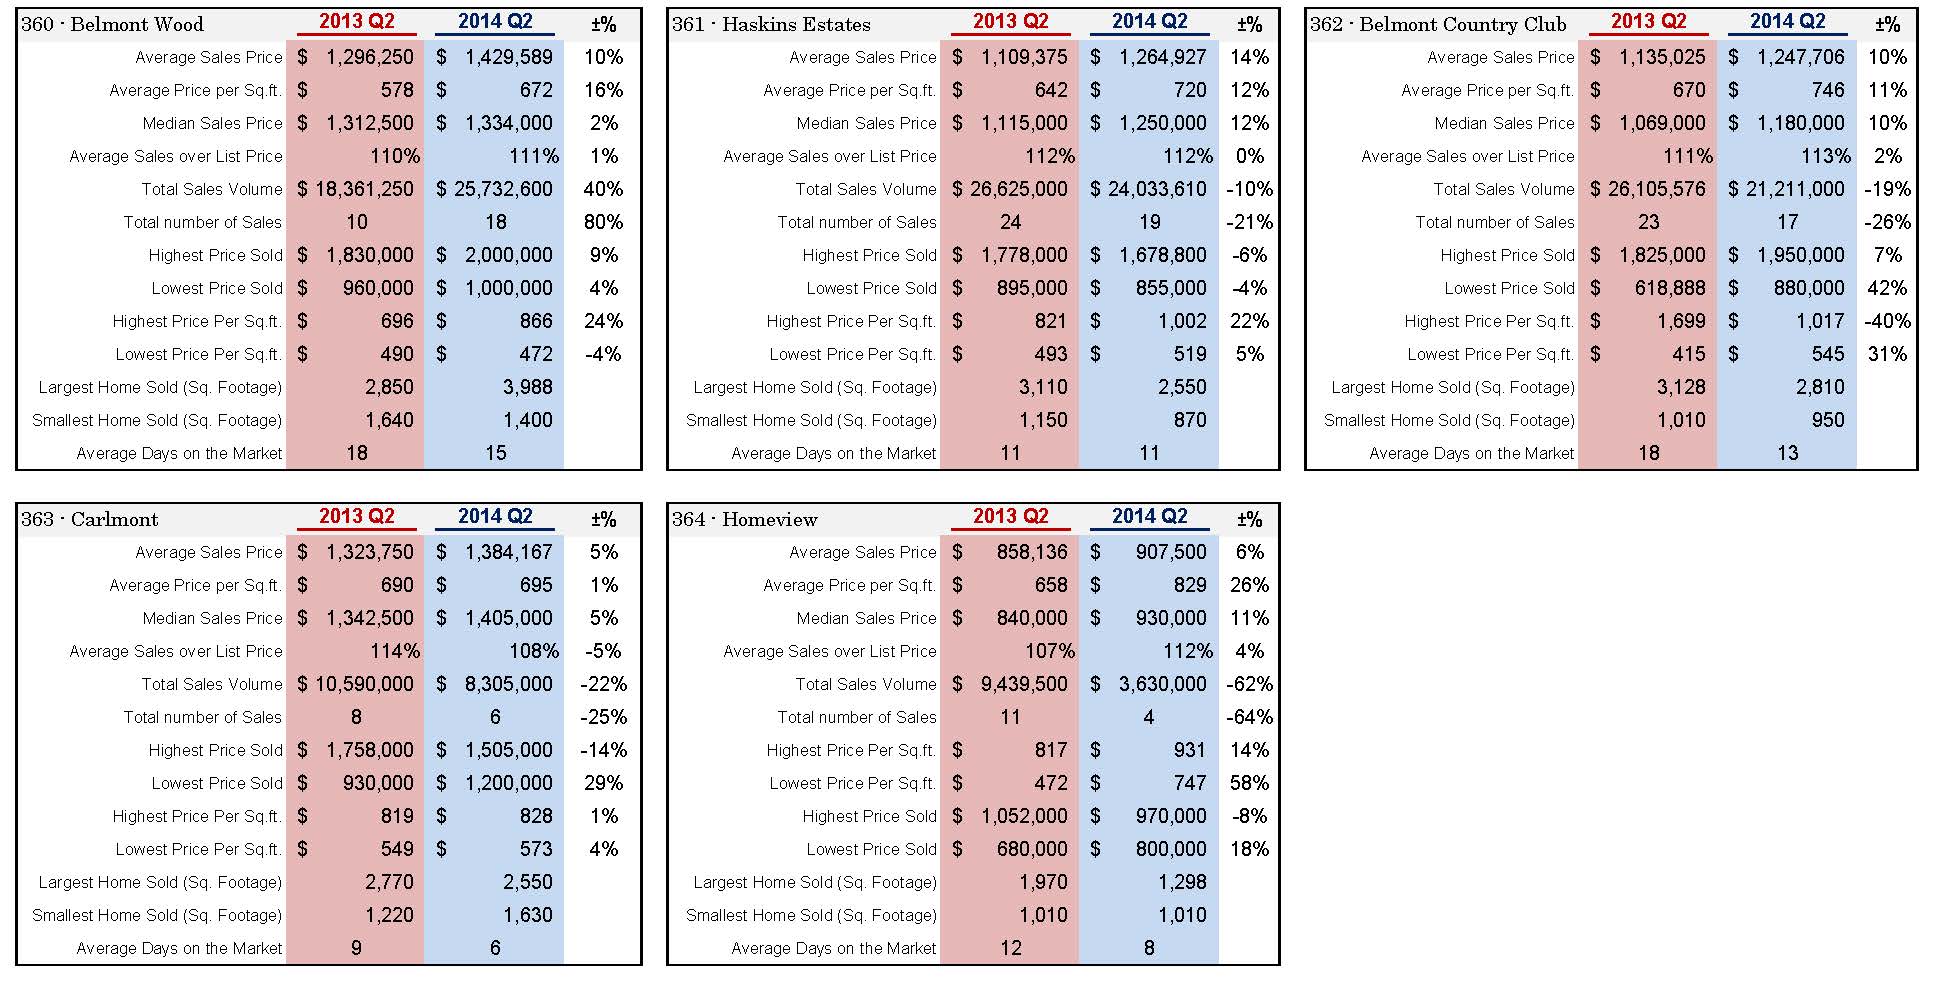
TOP PERCENTAGE GAIN IN AVERAGE SALES PRICE
In the 2nd quarter of 2014 compared to the 2nd quarter of 2013, Haskins Estates (361) has the top percentage gain in average sales price with an increase of 14% ($1,264,927 versus $1,109,375).
Belmont Wood (360) and Belmont Country Club (362) has the second percentage gain in average sales price with an increase of 10% ( $1,654,995 versus $1,375,167). Homeview (364) has the third percentage gain with an increase of 6% ($907,500 versus $858,136).
TOP PERCENTAGE GAIN IN AVERAGE SOLD PRICE PER SQUARE FEET
In the 2nd quarter of 2014 versus the 2nd quarter of 2013, Homeview (364) has the top percentage gain on the average price per square feet with an increase of 26% ($829 per sq ft in 2014 versus $658 per sq ft in 2013). Belmont Wood (360) has the second top percentage gain on the average price per square feet with an increase of 16% ($672 per sq ft in 2014 versus $578 per sq ft in 2013).
Haskins Estates (361) has the third percentage gains on the average price per sq ft with an increase of 12% ($720 per sq ft in 2014 versus $642 in 2013).
THE MOST EXPENSIVE VALUATION PER SQUARE FEET
In the 2nd quarter of 2014, Belmont Country Club (362) has the highest price sold per sq ft -$1,017 per sq ft (2008 Monroe Ave). This home has 3 bedrooms, 2 baths, and a 1,160 sq ft interior on a 4,000 sq ft lot. It was sold for $1,1800,000.
Haskins Estates (361) has the second highest price sold per square ft – $1,002 per sq ft (2401 Buena Vista). This one story home has 3 bedrooms,1 bath, and a 1,030 sq ft interior on a 6,210 sq ft lot. It sold for $1,032,000. Again, Belmont Country Club(362) has the third highest sold price per square feet- $983 per sq ft (1710 Francis Court). It is an updated home with 2 bedrooms, 1.5 bath with 1,200 interior sq ft on a 6,000 sq ft lot, it was sold for $1,180,000.
THE TOP NUMBER OF SALES TRANSACTIONS
In the 2nd quarter of 2014, Haskins Estates (361) has 19 sales transactions, Belmont Wood (360) has 18 sales transaction , and Belmont Country Club (362) has 17 sales transaction. In actuality, the majority of the Belmont neighborhoods have fewer sales transactions in the 2nd quarter of 2014 versus the 2nd quarter of 2013.
Thanks for visiting Beautiful Bay Homes! If you have any questions about the market data or anything else relating to real estate, please feel free to contact Henry Chu at Today Sotheby’s International Realty for more information.
Disclaimer: All data was collected from MLSListings®. All information is deemed reliable but not guaranteed by Henry Chu and Today Sotheby’s International Realty. Copyright@2014 Henry Chu. All rights reserved.
You must be logged in to post a comment.